People with asthma and other ailments are breathing a little easier these days in a number of metro areas across the U.S.
An analysis by the SelfStorage.com Moving Blog of data from the U.S. Environmental Protection Agency (EPA) reveals that among the 100 largest metro areas, the St. Louis, MO, area made the most progress from 2010 through 2014 in improving air quality. During the five-year period, the St. Louis area saw the percentage of good days for air quality soar by more than 220 percent, our analysis shows.
For this study, we looked at the EPA’s Air Quality Index data from the 100 biggest metro areas. The St. Louis area topped our list because its percentage of good days for air quality, as measured by the EPA index, rose from 12.1 percent in 2010 to 38.6 percent in 2014.
Janice Nolen, assistant vice president for national policy at the American Lung Association, noted that while the St. Louis area’s ozone levels have improved, that improvement has come on the heels of several years of worsening ozone pollution. As for pollution like dust and dirt, Nolen said St. Louis has followed a national trend of improvement in air quality, in part because of the cleanup of coal-fired power plants and the introduction of cleaner-burning diesel trucks.
“Air quality nationwide has improved significantly in the U.S. since 1970 and continues to improve, thanks to the Clean Air Act,” Nolen said.
It should come as little surprise that in 2014, the Honolulu, HI, area recorded the highest percentage of days for good air quality: 97.5 percent, up from 81.4 percent in 2010. By comparison, St. Louis jumped from 44 days for good air quality in 2010 to 141 days in 2014.
Assessing the air
Through thousands of monitoring stations around the country, the EPA and other government agencies collect data every day on five air pollutants regulated by the federal Clean Air Act: ground-level ozone (essentially a pollution cocktail), particle pollution (like dust, dirt and smoke), carbon monoxide (car exhaust), sulfur dioxide (industrial emissions) and nitrogen dioxide (a smelly reddish-brown gas). The EPA then crunches that data to come up with an index score; the lower the number, the better. The EPA considers a good day for air quality as one with a score from zero through 50.
The EPA says the index “focuses on health effects you may experience within a few hours or days after breathing unhealthy air.”
“Local air quality affects how you live and breathe. Like the weather, it can change from day to day or even hour to hour,” the EPA says.
Here is our ranking of the 15 metro areas with the most improvement in air quality from 2010 through 2014. Keep in mind that this list is based on the biggest gains in the percentage of good days for air quality.
1. St. Louis, MO
Percentage of good days for air quality in 2010: 12.1%
Percentage of good days for air quality in 2014: 38.6%
5-year improvement in percentage of good days for air quality: 220.45%
Number of good days for air quality in 2010: 44
Number of good days for air quality in 2014: 141
2. Akron, OH
Percentage of good days for air quality in 2010: 33.7%
Percentage of good days for air quality in 2014: 82.5%
5-year improvement in percentage of good days for air quality: 144.72%
Number of good days for air quality in 2010: 123
Number of good days for air quality in 2014: 301
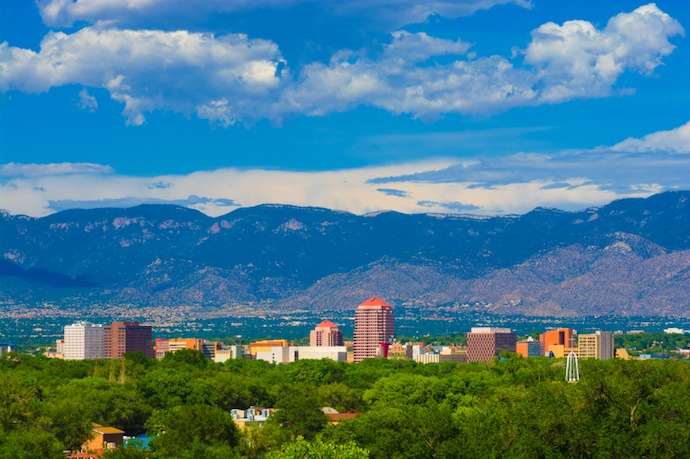
3. Albuquerque, NM
Percentage of good days for air quality in 2010: 30.7%
Percentage of good days for air quality in 2014: 64.4%
5-year improvement in percentage of good days for air quality: 109.82%
Number of good days for air quality in 2010: 112
Number of good days for air quality in 2014: 235
4. New Orleans, LA
Percentage of good days for air quality in 2010: 26.0%
Percentage of good days for air quality in 2014: 53.2%
5-year improvement in percentage of good days for air quality: 104.21%
Number of good days for air quality in 2010: 45
Number of good days for air quality in 2014: 194
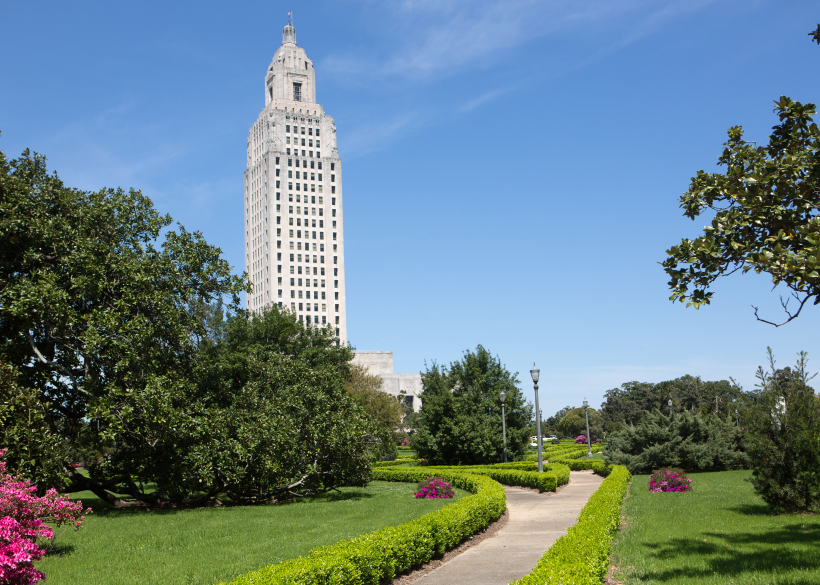
5. Baton Rouge, LA
Percentage of good days for air quality in 2010: 26.3%
Percentage of good days for air quality in 2014: 50.1%
5-year improvement in percentage of good days for air quality: 90.63%
Number of good days for air quality in 2010: 96
Number of good days for air quality in 2014: 183
6. Tulsa, OK
Percentage of good days for air quality in 2010: 35.6%
Percentage of good days for air quality in 2014: 65.8%
5-year improvement in percentage of good days for air quality: 84.62%
Number of good days for air quality in 2010: 130
Number of good days for air quality in 2014: 240
7. Memphis, TN
Percentage of good days for air quality in 2010: 39.7%
Percentage of good days for air quality in 2014: 65.8%
5-year improvement in percentage of good days for air quality: 65.52%
Number of good days for air quality in 2010: 145
Number of good days for air quality in 2014: 240
8. Boise, ID
Percentage of good days for air quality in 2010: 53.2%
Percentage of good days for air quality in 2014: 87.9%
5-year improvement in percentage of good days for air quality: 65.46%
Number of good days for air quality in 2010: 194
Number of good days for air quality in 2014: 321
9. Little Rock, AR
Percentage of good days for air quality in 2010: 40.8%
Percentage of good days for air quality in 2014: 63.8%
5-year improvement in percentage of good days for air quality: 56.38%
Number of good days for air quality in 2010: 149
Number of good days for air quality in 2014: 233
10. Charlotte, NC
Percentage of good days for air quality in 2010: 44.4%
Percentage of good days for air quality in 2014: 69.3%
5-year improvement in percentage of good days for air quality: 56.17%
Number of good days for air quality in 2010: 162
Number of good days for air quality in 2014: 253
11. Chicago, IL
Percentage of good days for air quality in 2010: 10.7%
Percentage of good days for air quality in 2014: 16.4%
5-year improvement in percentage of good days for air quality: 53.85%
Number of good days for air quality in 2010: 39
Number of good days for air quality in 2014: 60
12. Chattanooga, TN
Percentage of good days for air quality in 2010: 43.2%
Percentage of good days for air quality in 2014: 65.8%
5-year improvement in percentage of good days for air quality: 52.16%
Number of good days for air quality in 2010: 156
Number of good days for air quality in 2014: 240
13. Winston-Salem, NC
Percentage of good days for air quality in 2010: 46.6%
Percentage of good days for air quality in 2014: 70.1%
5-year improvement in percentage of good days for air quality: 50.59%
Number of good days for air quality in 2010: 170
Number of good days for air quality in 2014: 256
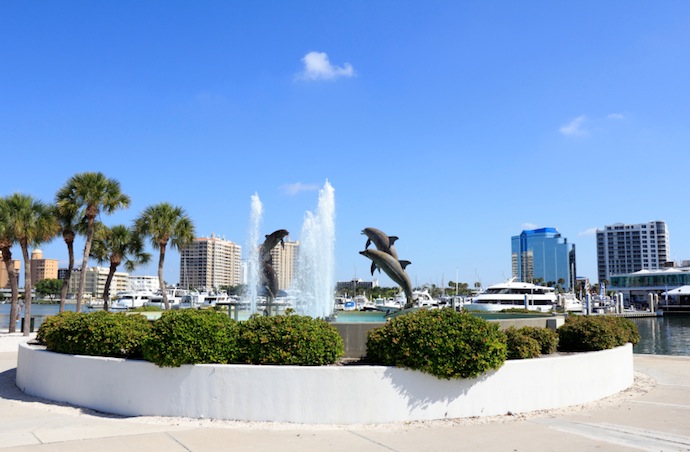
14. Sarasota-Bradenton, FL
Percentage of good days for air quality in 2010: 54.2%
Percentage of good days for air quality in 2014: 79.2%
5-year improvement in percentage of good days for air quality: 45.96%
Number of good days for air quality in 2010: 198
Number of good days for air quality in 2014: 289
15. Omaha, NE
Percentage of good days for air quality in 2010: 42.5%
Percentage of good days for air quality in 2014: 61.4%
5-year improvement in percentage of good days for air quality: 44.52%
Number of good days for air quality in 2010: 155
Number of good days for air quality in 2014: 224
Data source: U.S. Environmental Protection Agency
Data analysis by Elizabeth Whalen
Photos courtesy of Flickr/Nicholas Henderson, Flickr/Katie Wheeler, Flickr/Dave Thompson, City of Akron


