Outside of being the go-to conversation topic at the water cooler, weather plays a huge role in how we live. It affects our lifestyles, social structures and culture. It determines how we stay alive, how we transport ourselves, how and what we eat, and even how we feel.
Weather and temperature even affect us on a psychological level. A 2023 article published in Psychology Today confirmed what most of us already felt deep down: sunny and warm weather have a positive impact on hormones and behavior, putting us in a better mood. At the opposite end of the spectrum, we have the depressive effect of cold, rain and darkness. But heat and humidity don’t make us indifferent either — they increase our pain and stress levels and significantly lower the quality of our sleep.
Suffice it to say that weather, temperature and climate permeate every aspect of our daily life —whether we realize it or not. If you’re looking to move, check out our roundup of the best and worst of America’s largest cities to find a climate you can adapt to.
CITY WITH THE COLDEST WINTERS
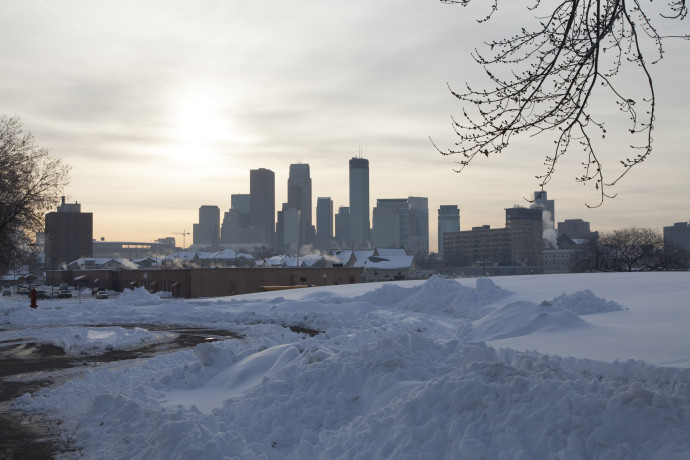
Minneapolis-St Paul Area, MN
December average: Low of 15.2, High of 28.8
Jan average: Low of 8.8, High of 23.6
February average: Low of 12.7, High of 28.5
The city and the state hold some of the most substantial records for meteorological events, stretching all the way back to 1819 and the lowest recorded temperature in Minnesota was -60 degrees on February 2, 1996.
Thanks to unhindered winds blowing down from Canada, Minnesota’s wind chill (how cold you’ll actually feel when outside) can make an already freezing day feel almost 20 degrees colder. It stays so cold in Minneapolis that its downtown buildings — corporate offices, gyms, banks, restaurants, etc. — are connected by 9.5 miles of enclosed pathways called the Skyway, so denizens can avoid going outdoors throughout the day.
A winter in the Twin Cities does have some hope, though — Minneapolis and St. Paul receive more winter sunlight than many other warmer parts of the country.
Runner Up For Coldest City
Fairbanks Area, AK
December average: Low of -13, High of 4.3
Jan average: Low of -17.2, High of 0.6
Feb average: Low of -11.2, High of 11.6
CITY WITH THE HOTTEST SUMMERS
Phoenix Area, AZ
June: High of 104.2, Low of 78.6
July: High of 106.5, Low of 84.5
August: High of 105.1, Low of 83.6
Summers in the Sonoran Desert are long, with the all-time record high sitting sweaty at 177.4 degrees surface temperature. Phoenix also “enjoys” the urban heat island effect, where a metropolitan area becomes much warmer than surrounding rural areas due to human activity. Not sure what that means? Suffice it to say, “Phoenix hit 110 degrees for 54 days in 2023.”
Summer temperatures can start as early as April and last through the middle of October. Don’t move here if you’ll pine for any sight of snow — the last time Phoenix saw a winter wonderland was a generous 0.4 inches on Dec. 22, 1990.
Runner up for hottest city
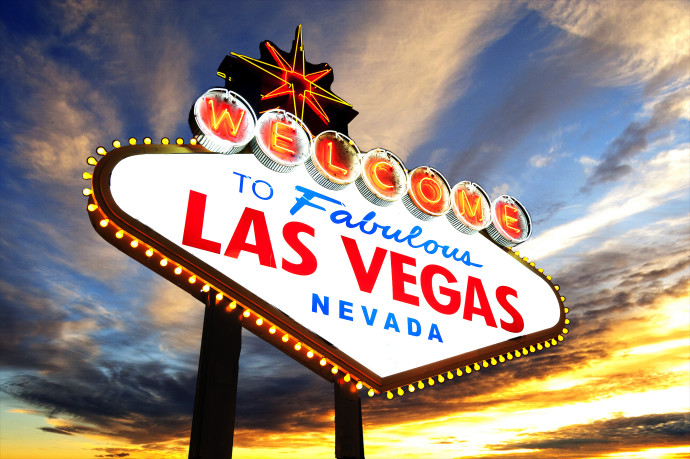
Las Vegas Area, NV
June: High of 99.4, Low of 75.8
July: High of 104.5, Low of 82.0
August: High of 102.8, Low of 80.6
BEST CITY FOR CONSISTENT TEMPERATURES
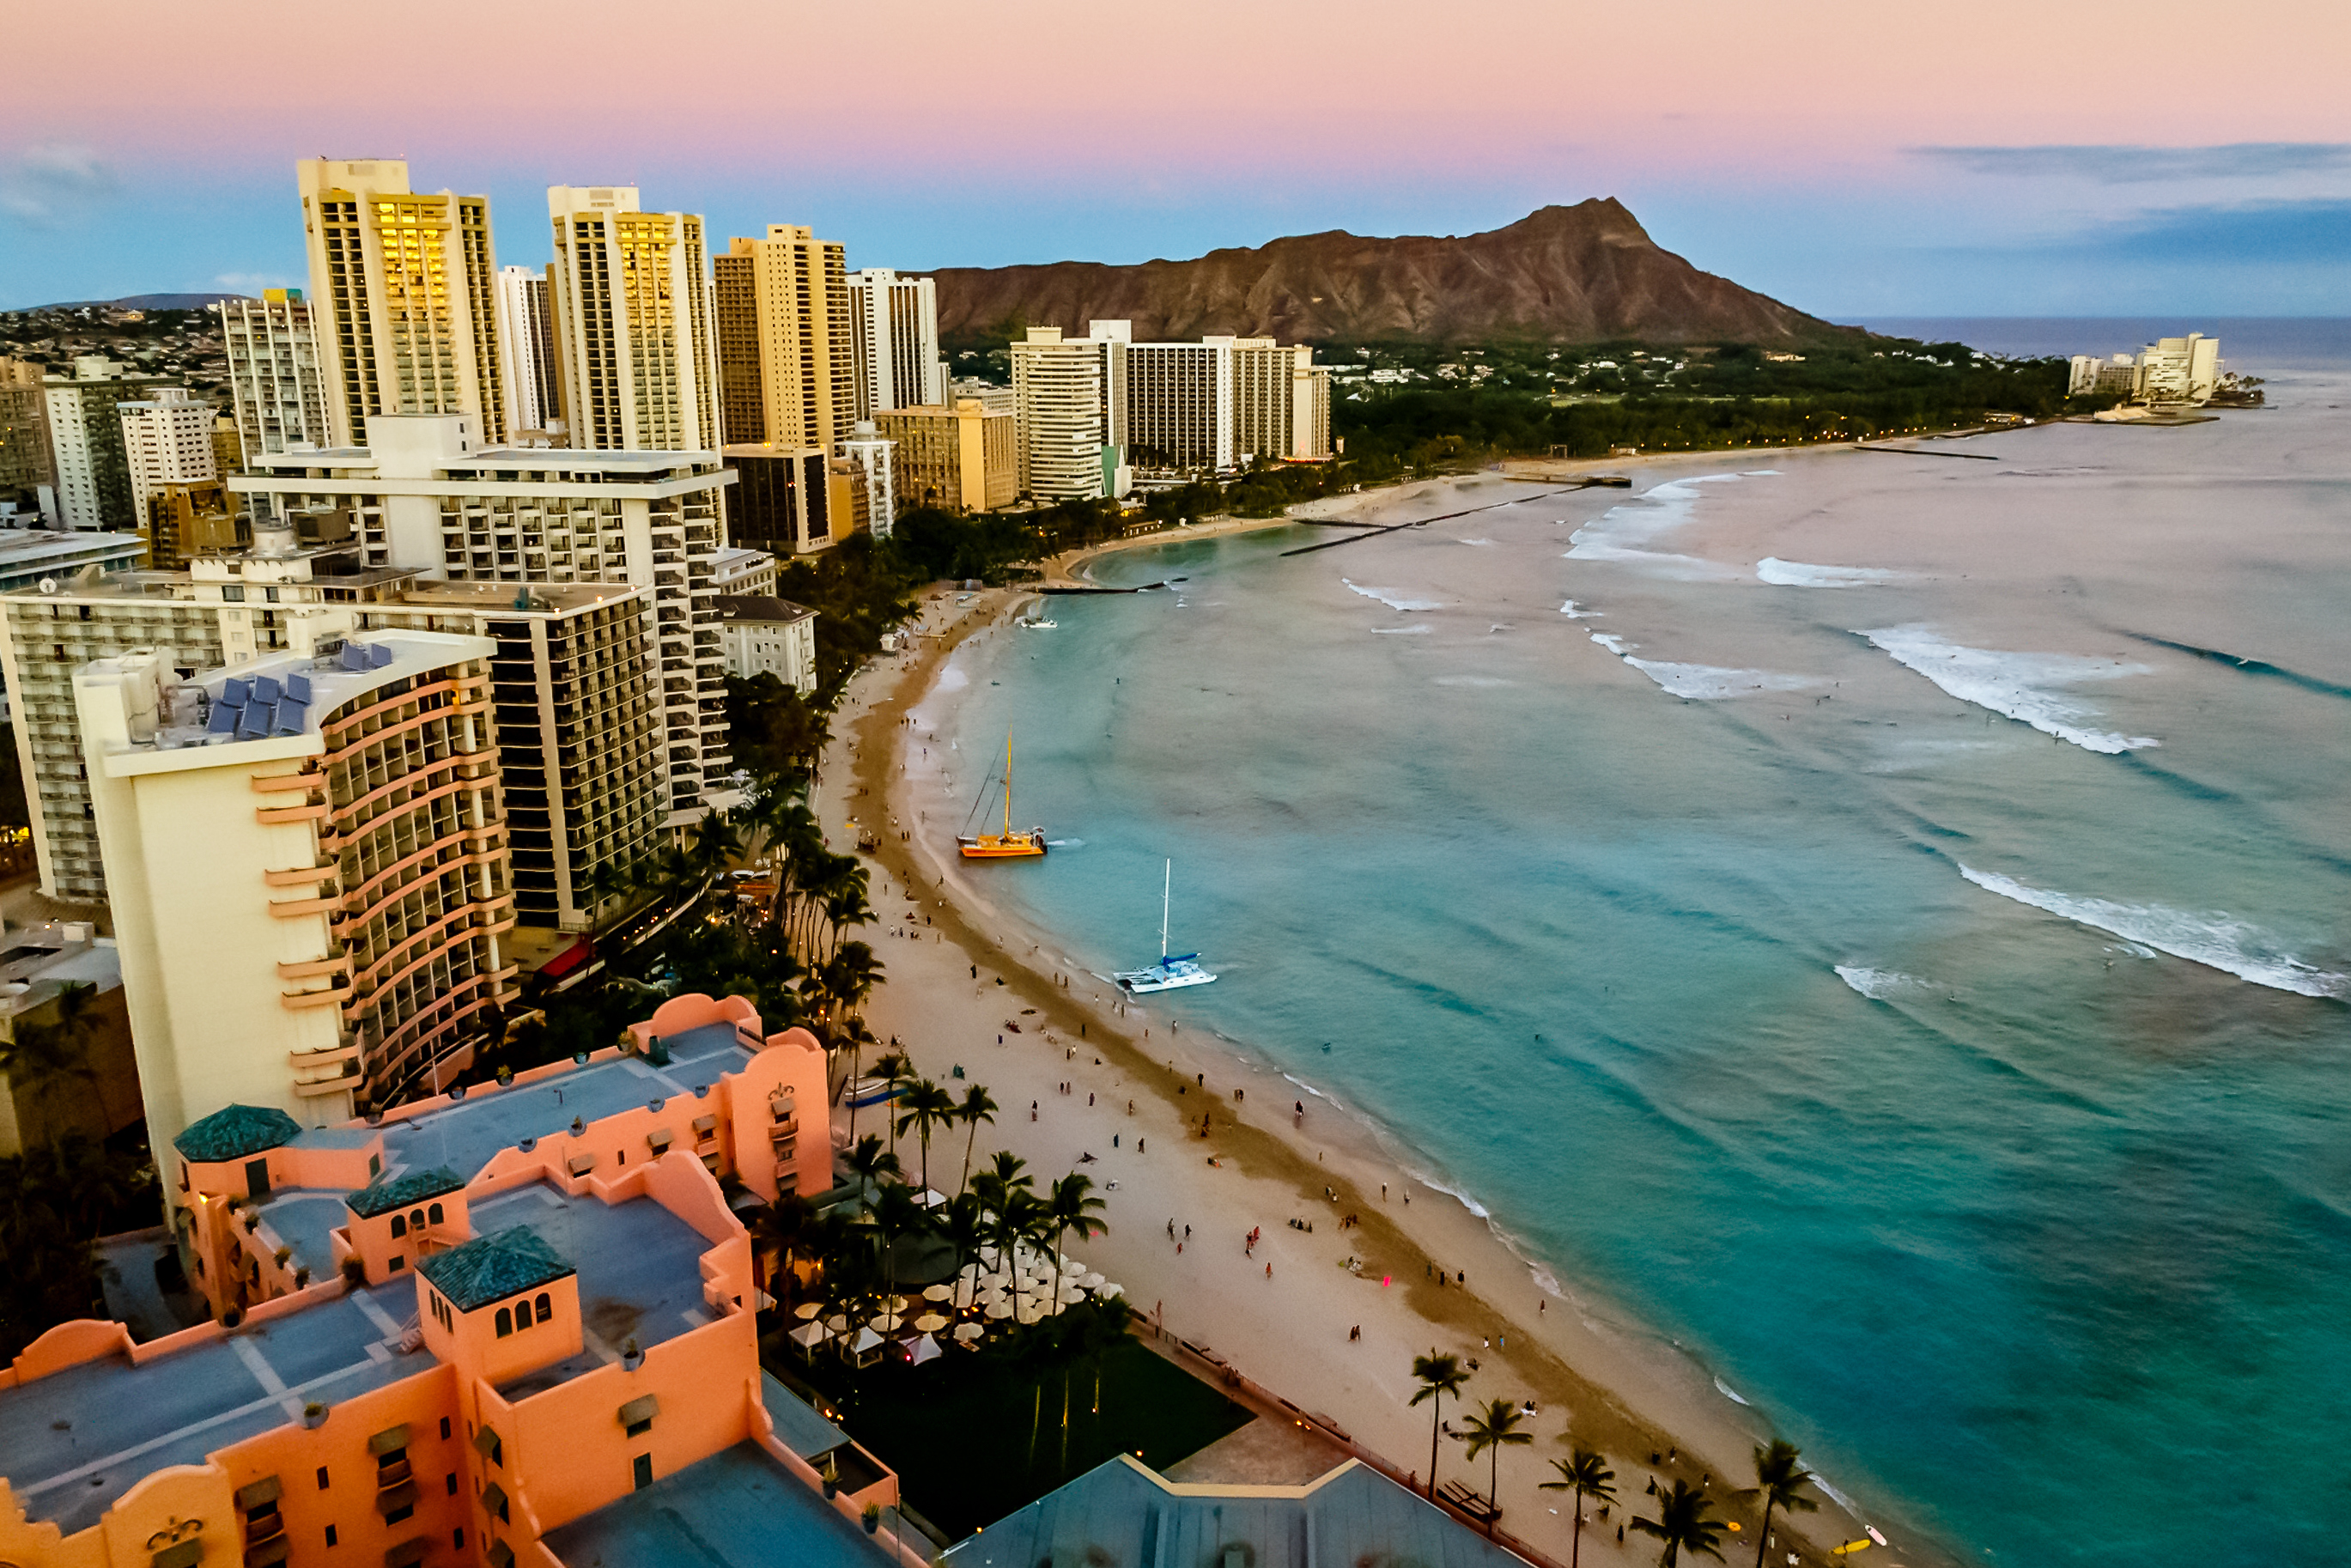
Honolulu Area, HI
Year-round average: 70-85 degrees Fahrenheit
If you’re a fan of predictable weather and tons of sunshine, Honolulu is the place to be. The city’s highs are never egregious, at least not yet, and lows rarely fall below the 70-degree mark. Other smaller spots in Hawaii also make the cut for consistent temperatures and moderate humidity — think Lihue or Kahului.
As if that wasn’t enough, the length of day in Hawaii is also relatively uniform throughout the year. In fact, that’s half of the secret to its small seasonal variations. The other half: the surrounding ocean acts like a thermostat.
Runner Up For City With Most Consistent Temperatures
San Diego Area, CA
Year-round average: 60-70 degrees Fahrenheit
CITY WITH THE MOST SNOW
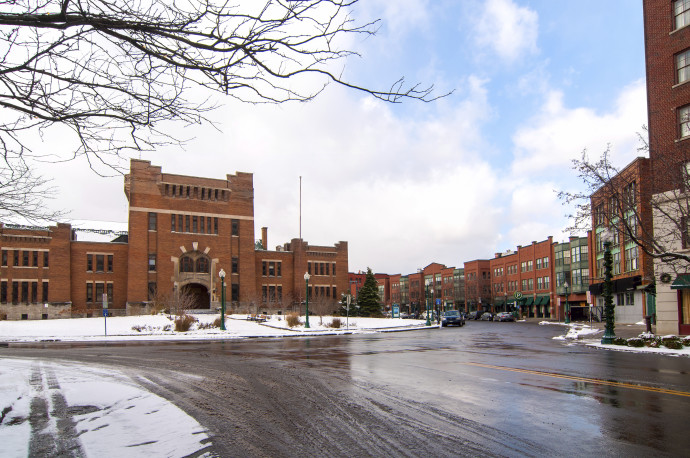
Syracuse Area, NY
Average snowy days per year: 64
The earliest snow of the year in Syracuse in the past two decades has been recorded in October 2016, and the latest of the season in May 2010. And if you thought winter typically means December to February, know that Syracusans braced no fewer than 18 snowy days in March 2001 and 8 days in April 2018.
Quantity also matters, of course. Syracuse gets an average of over 10 feet of snow per year, making everyone else’s snow troubles look like child’s play. In addition to being a frequent winner of the Golden Snowball Award, Syracuse also holds several notable blizzards under its belt. Both the 1993 Storm of the Century and the North American blizzard of 1966 took the city into record-shattering realms with 42 inches of snowfall each.
Runner Up For City With The Most Snow
Rochester Area, NY
Average snowy days per year: 64
CITIES WHERE LOCALS HAVE PROBABLY NEVER SEEN SNOW BEFORE
The following large cities had no snow days recorded by NOAA this century:
- Los Angeles, CA
- Miami Area, FL
- San Francisco, CA
- Phoenix Area, AZ
- Riverside Area, CA
- San Diego Area, CA
- Tampa Area, FL
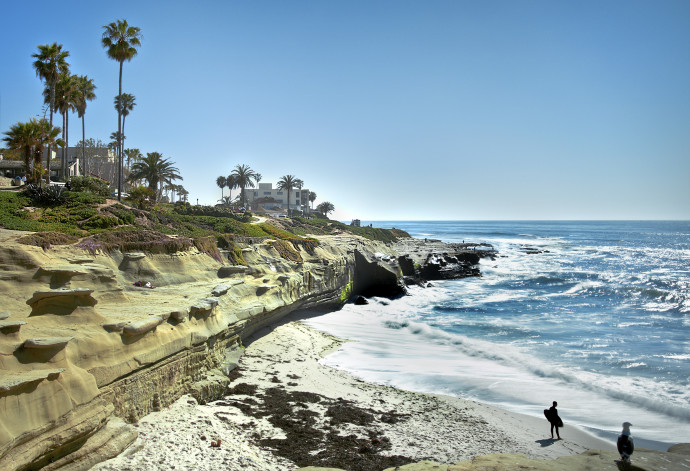
La Jolla Shores Coastline in San Diego is one of several places in the U.S. where snow days are a foreign concept.
CITY WITH THE MOST RAIN
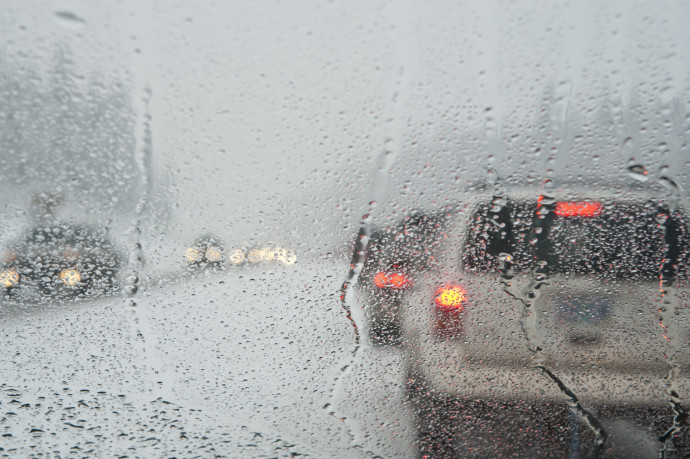
Seattle City Area, WA
Average rainy days per year: 165
Moisture is the essence of wetness, and wetness is the essence of Seattle. According to NOAA, Seattle gets an average of 37.35 inches of rain annually—that’s 7.41 inches (!) more than the national average. The rainiest months are October through March, so while you may develop webbed feet from living in the Sea-Tac area, you can still enjoy a relatively dry summer, with only light rain and drizzles.
However, its reputation as the rainiest city in the U.S. does not take into account small municipalities. To put things into perspective, know that Bremerton, WA, gets an average of 60 inches of rain every year. And it’s only a 15-mile ferry ride away from Seattle.
Runner Up For City With Most Rain
Pittsburgh, PA
Average rainy days per year: 157
CITY WITH THE LEAST RAIN
Las Vegas Area, NV
Average rainy days per year: 24
True to its desert roots, Las Vegas typically gets less than four inches of rain per year. You won’t be entirely safe from rainstorms though: Sin City enjoys a phenomenon known as “monsoon season” during the summer. When it does rain, it pours — and leaves as quickly as it came. Pretty appropriate for a city that runs at 100 miles per hour all year long.
Again, smaller cities boast more impressive figures. For instance, Yuma, AZ, sees an average of 15 rainy days a year, with only one rainy day in 2002. That’s as dry as it gets for a populated place. It’s also where you’re bound to get the most sunshine hours: over 4,000 every year! The next in line for sunshine are Phoenix, Las Vegas, Tucson and El Paso.
Runner Up For City With Least Rain
Phoenix Area, AZ
Average rainy days per year: 32
Methodology
To compile this list, we analyzed data from NOAA taking into account the top 100 most populous U.S. cities, and looking into some outliers as well.


