
Move over, New York City, NY, and San Francisco, CA. You’ve got some company when it comes to packing in people.
The SelfStorage.com Moving Blog crunched U.S. Census Bureau data to produce a list of the 11 U.S. metros that are witnessing the most growth in population coupled with the most growth in population density. For this list, we matched the percentage change in population from 2000 through 2010 with the percentage change in average number of residents per square mile during the same time span. These were the latest figures available for an apples-to-apples comparison.
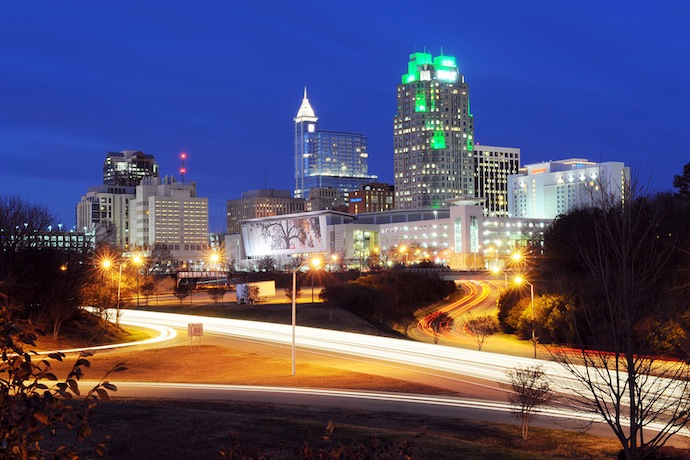
Raleigh, NC, leads our list, which covers the country’s 100 largest metro areas. During the 10-year period, the population of the Raleigh area rose by 41.8 percent, while the area’s population density jumped by 9.2 percent. Marrying those two percentages put Raleigh at No. 1 in our ranking.
More growth on the horizon
Even under what’s considered the slowest-growth scenario, the Raleigh area promises to become even more crowded. From 2010 through 2030, the region’s population is projected to grow by 24 percent, according to the University of North Carolina’s Carolina Population Center. (The region’s population grew nearly 10 percent from 2010 to 2014, approaching 1.25 million.)
For the four-county Raleigh metro area, net migration — more people moving into the area than moving out of the area — is the biggest driver of population growth, according to Rebecca Tippett, director of Carolina demography at the Carolina Population Center. Net migration accounts for about two-thirds of the region’s growth since 2010, she said. About one-fourth of new arrivals are from other countries.
“In general, population density should increase as population grows and decrease as population declines, especially with metropolitan areas,” Tippett said.
What’s behind the boom?
Jennifer Song, state demographer in North Carolina, attributes the influx of people into the Raleigh area to factors like a flourishing economy, a wealth of job opportunities, an assortment of high-quality schools, and an abundance of cultural and recreational amenities.
“Raleigh and the greater Triangle region are consistently ranked among the top places to live and work,” Song said.
Based on our data analysis, here are the top 11 metro areas that are getting more crowded. By the way, New York City and San Francisco — the country’s two most densely populated metro areas — didn’t make our list.
1. Raleigh, NC
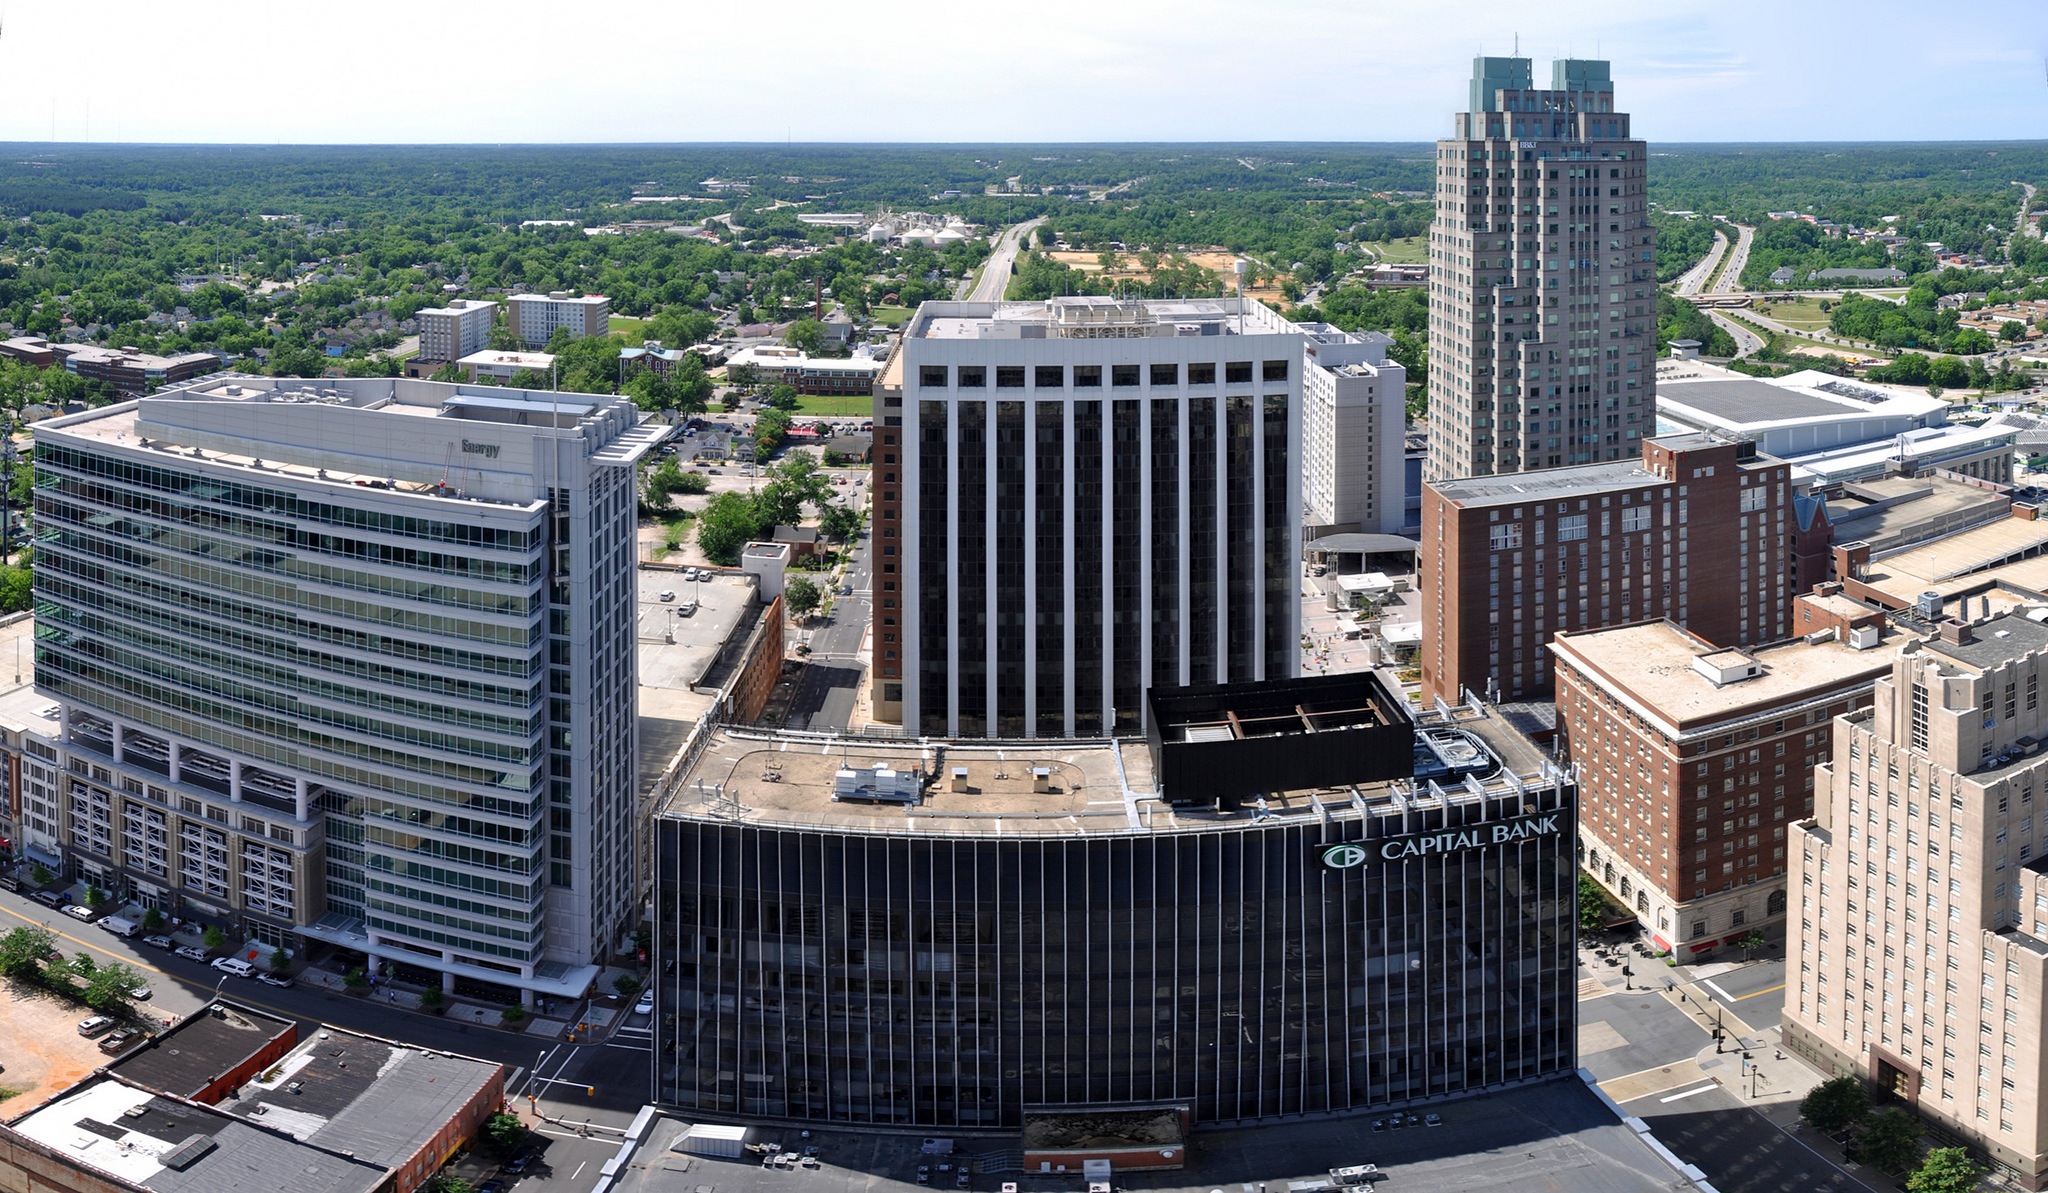
Population in 2000: 797,071
Population in 2010: 1,130,490
2000-2010 increase in population: 41.8%
Average number of people per square mile in 2000: 1,694.05
Average number of people per square mile in 2010: 1,850.15
2000-2010 increase in population density: 9.2%
2. McAllen, TX

Population in 2000: 569,463
Population in 2010: 774,769
2000-2010 increase in population: 36.1%
Average number of people per square mile in 2000: 1,863.89
Average number of people per square mile in 2010: 2,083.79
2000-2010 increase in population density: 11.8%
3. Charlotte, NC

Population in 2000: 1,330,448
Population in 2010: 1,758,038
2000-2010 increase in population: 32.1%
Average number of people per square mile in 2000: 1,738.09
Average number of people per square mile in 2010: 1,881.26
2000-2010 increase in population density: 8.2%
4. Riverside-San Bernardino-Ontario, CA
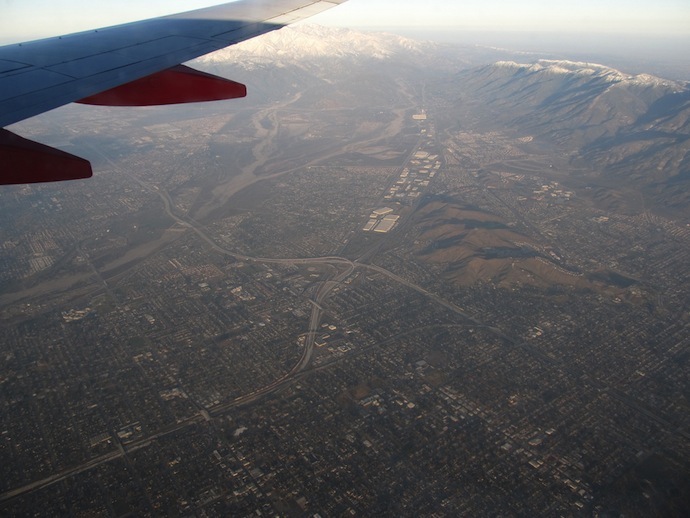
Population in 2000: 3,254,821
Population in 2010: 4,224,851
2000-2010 increase in population: 29.8%
Average number of people per square mile in 2000: 4,060.38
Average number of people per square mile in 2010: 4,299.61
2000-2010 increase in population density: 5.9%
5. Albuquerque, NM

Population in 2000: 729,649
Population in 2010: 887,077
2000-2010 increase in population: 21.6%
Average number of people per square mile in 2000: 3,310.17
Average number of people per square mile in 2010: 3,518.60
2000-2010 increase in population density: 6.3%
6. Bakersfield, CA
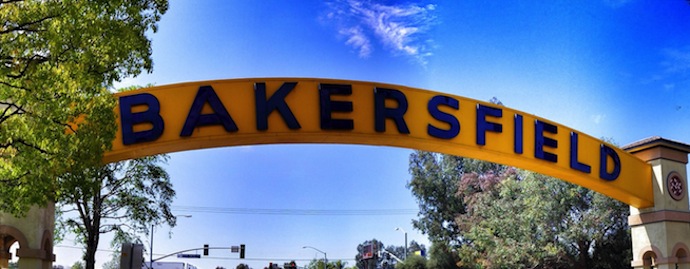
Population in 2000: 661,645
Population in 2010: 839,631
2000-2010 increase in population: 26.9%
Average number of people per square mile in 2000: 3,631.22
Average number of people per square mile in 2010: 3,711.52
2000-2010 increase in population density: 2.2%
7. Portland, OR

Population in 2000: 1,927,881
Population in 2010: 2,226,009
2000-2010 increase in population: 15.5%
Average number of people per square mile in 2000: 3,994.40
Average number of people per square mile in 2010: 4,372.60
2000-2010 increase in population density: 9.5%
8. Nashville, TN
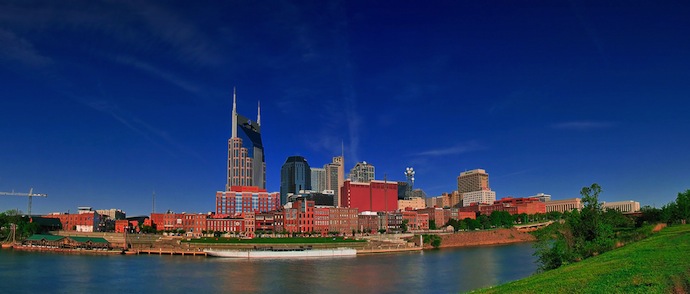
Population in 2000: 1,311,789
Population in 2010: 1,589,934
2000-2010 increase in population: 21.2%
Average number of people per square mile in 2000: 1,660.61
Average number of people per square mile in 2010: 1,695.26
2000-2010 increase in population density: 2.1%
9. Lakeland-Winter Haven, FL
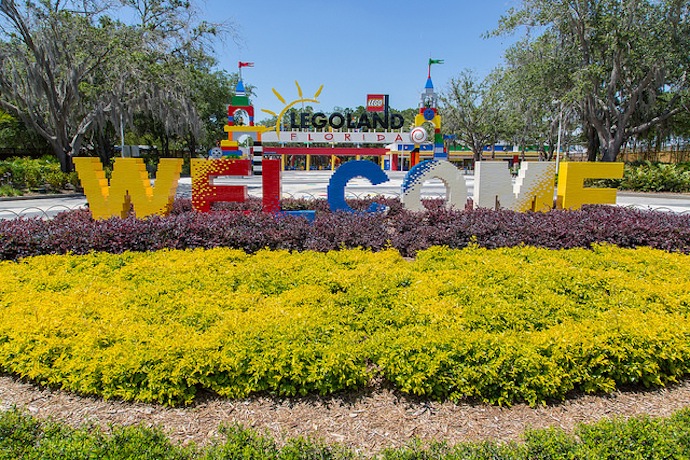
Population in 2000: 483,924
Population in 2010: 602,095
2000-2010 increase in population: 24.4%
Average number of people per square mile in 2000: 1,455.97
Average number of people per square mile in 2010: 1,462.80
2000-2010 increase in population density: 0.5%
10. Ogden, UT
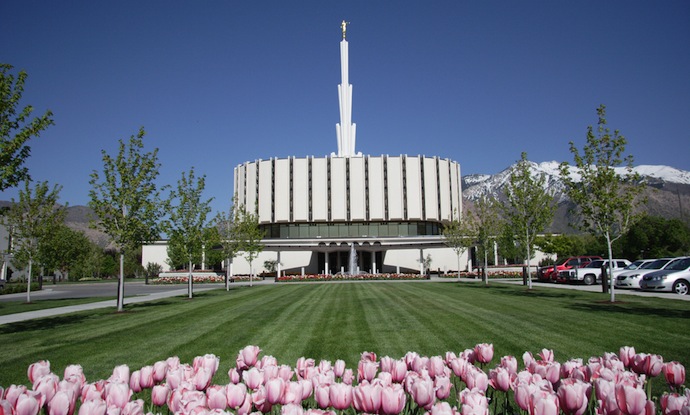
Population in 2000: 442,656
Population in 2010: 547,184
2000-2010 increase in population density: 23.6%
Average number of people per square mile in 2000: 2,917.11
Average number of people per square mile in 2010: 2,937.39
2000-2010 increase in population density: 0.7%
11. Greenville, SC

Population in 2000: 559,940
Population in 2010: 636,986
2000-2010 increase in population: 13.8%
Average number of people per square mile in 2000: 1,187.99
Average number of people per square mile in 2010: 1,264.83
2000-2010 increase in population density: 6.5%
Data analysis by Elizabeth Whalen
Photos courtesy of Flickr/Leo Suarez, Flickr/NCDOTcommunications, Flickr/James Willamor, Flickr/Ken Lund, Flickr/Duncan Rawlinson, Flickr/Patrick Shanks, Flickr/Thomas Hawk, Flickr/Jeff Reid, Flickr/Matthew Paulson, Flickr/Murry Dalton, Flickr/Matt Bateman, Flickr/Derrick Story