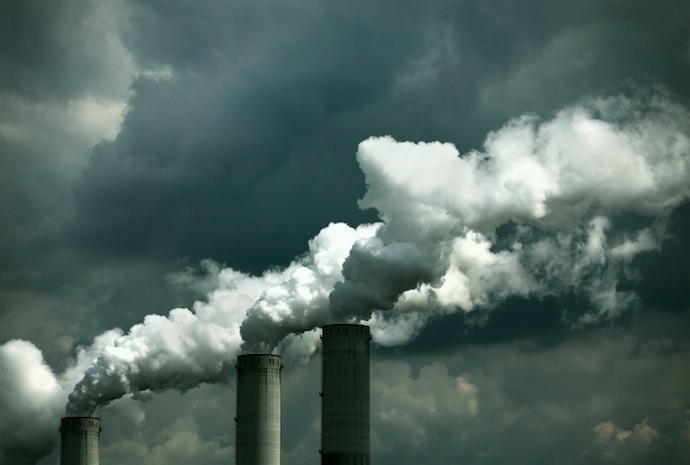
Asthma sufferers, take note: Your lungs might thank you if you don’t move to Bakersfield, CA.
An analysis by the SelfStorage.com Moving Blog of data from the U.S. Environmental Protection Agency (EPA) found that the number of days for good air quality in the Bakersfield metro area dropped nearly 56 percent from 2010 to 2014. That was the biggest percentage decline among the country’s 100 largest metro areas.
In 2010, the Bakersfield area recorded 120 days for good air quality, as gauged by the EPA. That number plummeted to 53 in 2014.
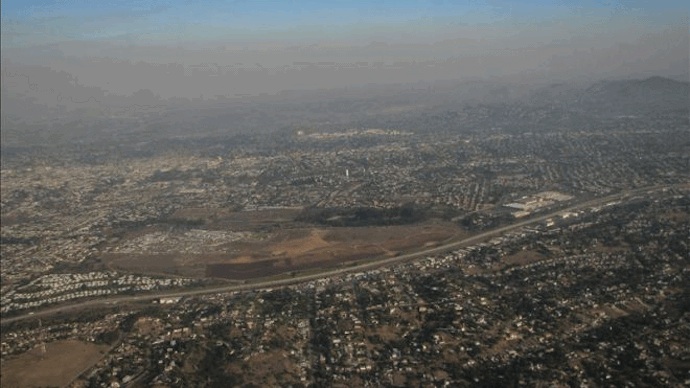
Last year, Time magazine dubbed Bakersfield “the worst place to breathe in America.” According to Time, Bakersfield’s topography — a valley surrounded by mountains — “creates a bowl that traps air pollution.”
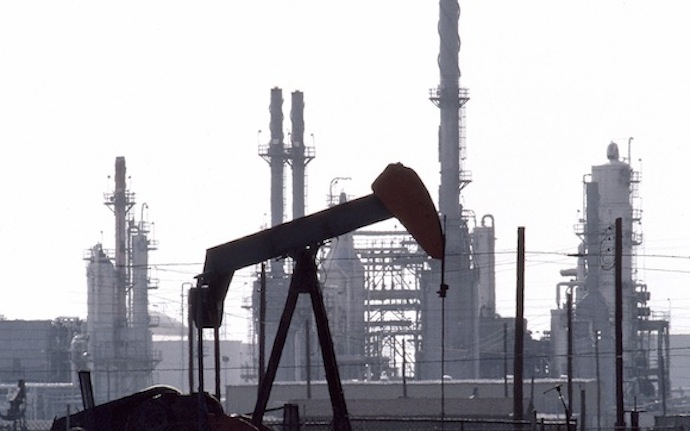
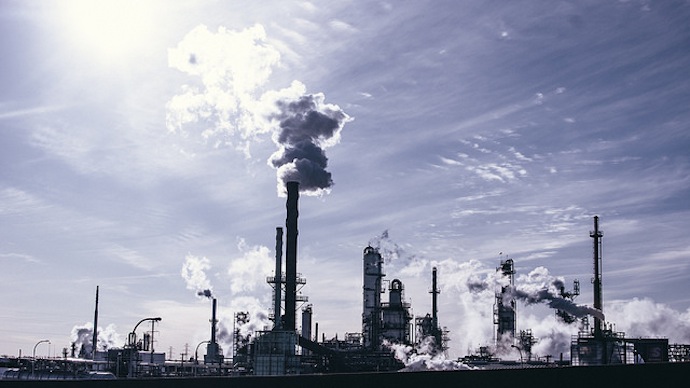
Oil production contributes to pollution in the Bakersfield, CA, metro area.
Farming in the Bakersfield area “whips up” a mix of dust, pesticides and fertilizers, Dr. Joel Kaufman, director of the Occupational and Environmental Medicine Program at the University of Washington, told Health magazine. Pollution from cars, big rigs and oil companies adds to the problem, according to WebMD.
Working to clear the air
Jaime Holt, a spokeswoman for the San Joaquin Valley Air Pollution Control District, said severe drought conditions over the past several years in Bakersfield and throughout the valley have diluted the region’s previous advances in cutting summertime ozone levels. The 250-mile-long valley includes Bakersfield, Fresno, Modesto and Stockton; three of those four cities appear on our list.
“We have had consecutive winters that have been stagnant and the perfect conditions for the creation and trapping of pollution,” Holt said.
However, Holt noted that this July in the San Joaquin Valley was the healthiest July for ozone levels since 1995.
Bakersfield and the rest of the valley are subject to the strictest air quality regulations in the U.S., she said. Over the past 20 years, more than $40 billion has been pumped into efforts to improve air quality in the region, according to Holt. As a result, she said, the valley has seen “significant improvements” in air quality during that period.
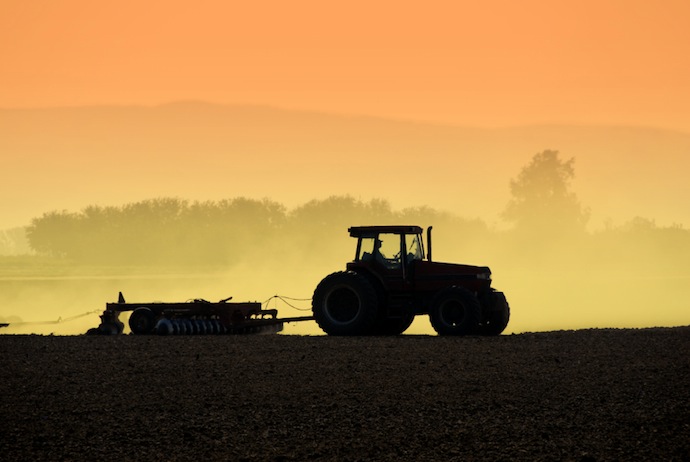
The San Joaquin Valley forms the backbone of California’s agriculture economy.
California coughin’
Bakersfield is one of seven California metro areas that show up on our list. According to the California Air Resources Board, key factors contributing to the Golden State’s air pollution are:
- Being the largest state, with nearly 39 million residents.
- Having terrain, like mountain-enclosed valleys, that traps pollution.
- Having a warm, sunny climate that helps create ozone and other air pollutants.
“During personal and business activities, Californians release thousands of tons of pollutants into the air every day. Although each of us may only produce a small amount of air pollution, the combined pollution from … Californians adds up to a big problem,” the Air Resources Board says.
The data for our ranking comes from the EPA’s Air Quality Index. Monitoring stations across the country report the five most common air pollutants that the EPA regulates: ground-level ozone, particle pollution, carbon monoxide, sulfur dioxide and nitrogen dioxide. The EPA then sifts through that data to come up with an area’s daily index. On a good day for air quality, the index ranges from zero to 50; the lower the number, the better the air quality.
According to the EPA, the index “tells the public how clean or polluted the air is and how to avoid potential associated health effects.”
Here’s our ranking of the 15 metro areas in the U.S. where the number of days for good air quality dropped the most from 2010 to 2014.
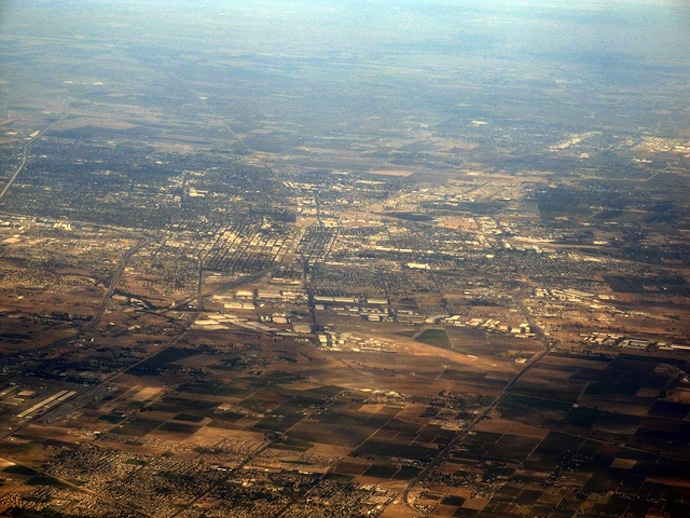
1. Bakersfield, CA
Number of days for good air quality in 2010: 120
Number of days for good air quality in 2014: 53
5-year decrease in number of days for good air quality: 55.83%
2. Phoenix, AZ
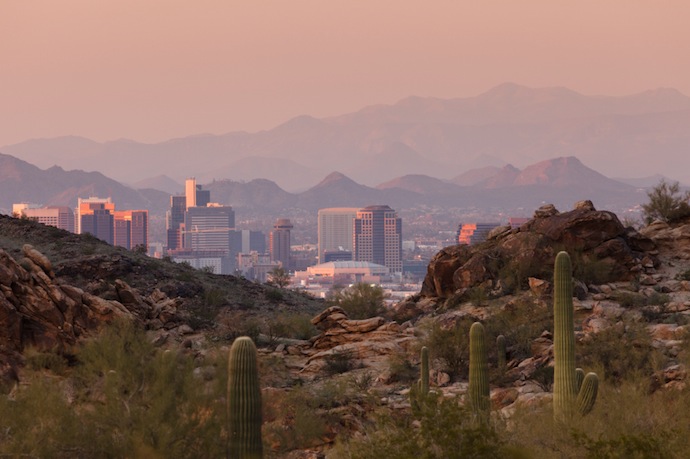
Number of days for good air quality in 2010: 63
Number of days for good air quality in 2014: 29
5-year decrease in number of days for good air quality: 53.97%
3. Riverside-San Bernardino-Ontario, CA
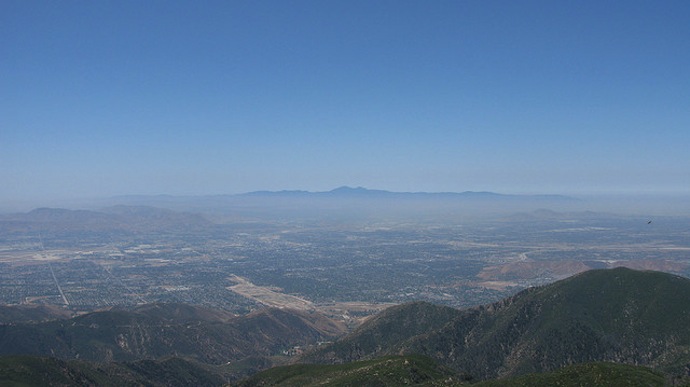
Number of days for good air quality in 2010: 22
Number of days for good air quality in 2014: 13
5-year decrease in number of days for good air quality: 40.91%
4. Oxnard, CA
Number of days for good air quality in 2010: 259
Number of days for good air quality in 2014: 179
5-year decrease in number of days for good air quality: 30.89%
5. Los Angeles, CA
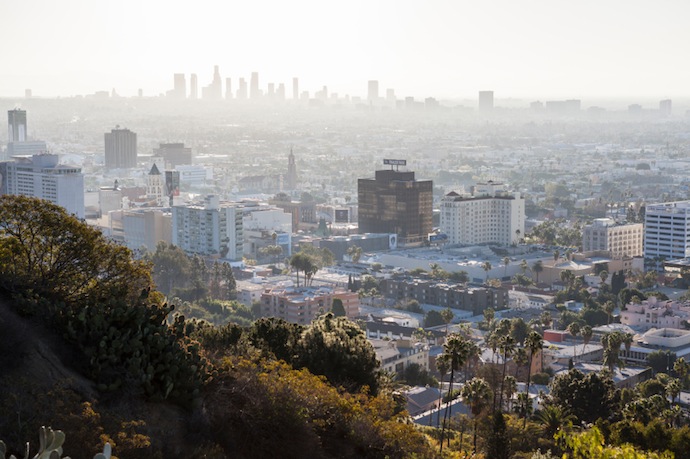
Number of days for good air quality in 2010: 34
Number of days for good air quality in 2014: 25
5-year decrease in number of days for good air quality: 26.47%
6. Detroit, MI
Number of days for good air quality in 2010: 175
Number of days for good air quality in 2014: 129
5-year decrease in number of days for good air quality: 26.29%
7. Stockton, CA
Number of days for good air quality in 2010: 236
Number of days for good air quality in 2014: 185
5-year decrease in number of days for good air quality: 21.61%
8. Fresno, CA
Number of days for good air quality in 2010: 119
Number of days for good air quality in 2014: 95
5-year decrease in number of days for good air quality: 20.17%
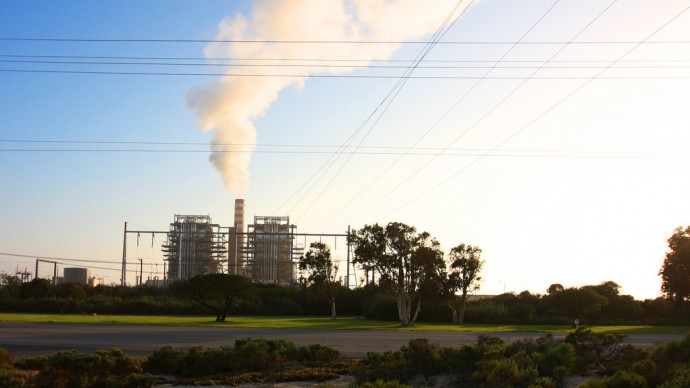
9. Kansas City, MO
Number of days for good air quality in 2010: 120
Number of days for good air quality in 2014: 97
5-year decrease in number of days for good air quality: 19.17%
10. Philadelphia, PA

Number of days for good air quality in 2010: 113
Number of days for good air quality in 2014: 92
5-year decrease in number of days for good air quality: 18.58%
11. Jackson, MS
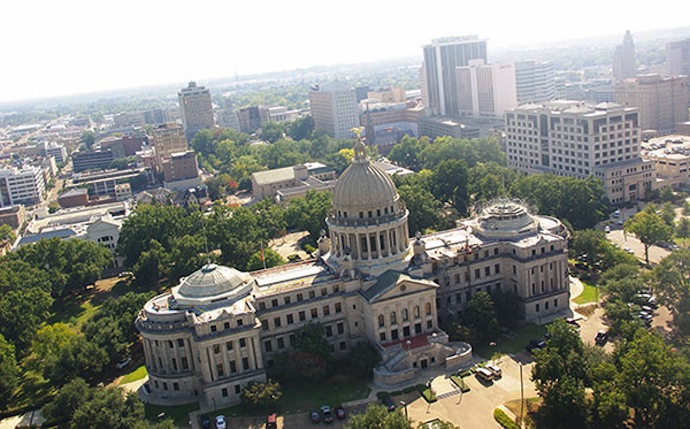
Number of days for good air quality in 2010: 224
Number of days for good air quality in 2014: 184
5-year decrease in number of days for good air quality: 17.86%
12. Sacramento, CA

Number of days for good air quality in 2010: 207
Number of days for good air quality in 2014: 171
5-year decrease in number of days for good air quality: 17.39%
13. Grand Rapids, MI
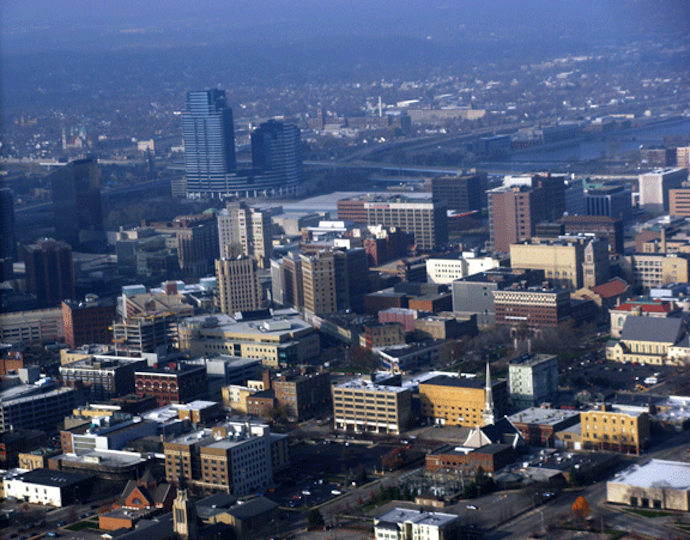
Number of days for good air quality in 2010: 304
Number of days for good air quality in 2014: 260
5-year decrease in number of days for good air quality: 14.47%
14. Hartford, CT
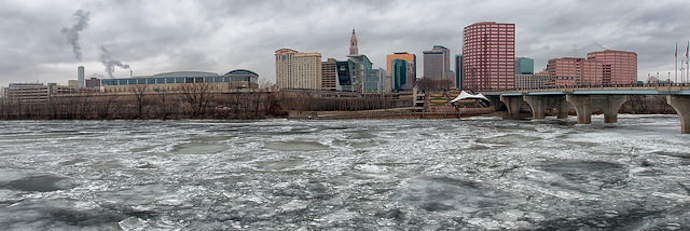
Number of days for good air quality in 2010: 287
Number of days for good air quality in 2014: 249
5-year decrease in number of days for good air quality: 13.24%
15. Las Vegas, NV
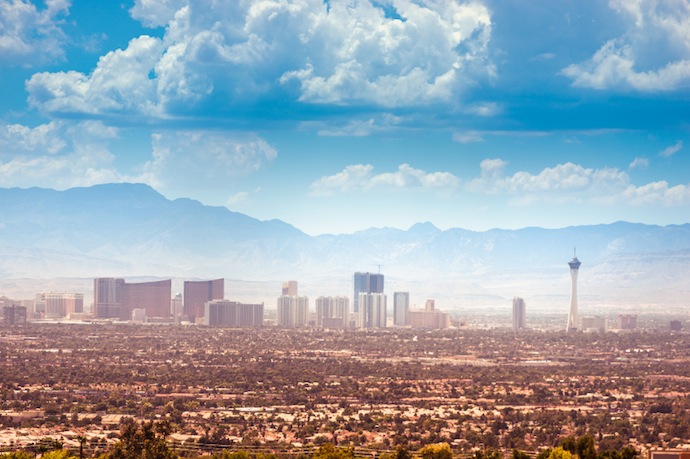
Number of days for good air quality in 2010: 194
Number of days for good air quality in 2014: 169
5-year decrease in number of days for good air quality: 12.89%
Data source: U.S. Environmental Protection Agency
Data analysis by Elizabeth Whalen
Photos courtesy of RichardNilsen.com, Flickr/miheco, Flickr/Rennett Stowe, Flickr/Mark b, Flickr/Ken Lund, Flickr/purpletwinkie, Missouri Department of Natural Resources, Clean Air Council, Flickr/Kevin Cortopassi, No Easy Beads, Flickr/ilirjan rrumbullaku


