Whether you love them for their quiet neighborhoods and low taxes or hate them for their strip malls and conformity, suburbs are a fixture of American life. Some of them are booming economically and attracting new residents as a result. Twelve of those suburbs topped SelfStorage.com’s list of America’s Power Suburbs.
To rank these ’burbs, we looked at changes in five metrics: population, per-capita income, percentage of families bringing in $75,000 or more a year, unemployment rate and percentage of people living below the poverty line. Jumps in population, per-capita income and $75,000-and-over income boosted a suburb’s ranking, while rises in the unemployment rate and the percentage of people living in poverty reduced it. We compared 2010 data with 2013 data, the latest numbers available from the U.S. Census Bureau, and we excluded places that were more than 40 miles from a major city.
Here is SelfStorage.com’s list of America’s Top 12 Power Suburbs.
1. Clarksville, IN
 Clarksville, about four miles from Louisville, KY, is where the first Texas Roadhouse restaurant opened. It topped our list because it scored well across all categories and saw a substantial drop in the number of people living below the poverty line.
Population: 21,720
Population growth: 1.2 percent
Per-capita income: $22,749
Per-capita income growth: 15.5 percent
Percentage of families with income of $75,000 or more: 32.8 percent
Change in percentage of families with income of $75,000 or more: 75.4 percent
Percentage of people living below the poverty line: 10.7 percent
Change in percentage of people living below the poverty line: -42.2 percent
Unemployment rate: 3.3 percent
Change in unemployment rate: -21.4 percent
2. Greenfield, IN
 Greenfield, about 25 miles east of Indianapolis, is the global headquarters of Elanco, the animal health division of pharmaceutical giant Eli Lilly. Greenfield outranked Clarksville in a few categories but was slightly behind in the others.
Population: 21,855
Population growth: 8.3 percent
Per-capita income: $23,580
Per-capita income growth: 14.3 percent
Percentage of families with income of $75,000 or more: 36.1 percent
Change in percentage of families with income of $75,000 or more: 29.4 percent
Percentage of people living below the poverty line: 8 percent
Change in percentage of people living below the poverty line: -45.6 percent
Unemployment rate: 4.9
Change in unemployment rate: -31.9 percent
3. Marysville, OH
 Marysville, about 30 miles northwest of Columbus, is home to lawn and garden products maker Scotts Miracle-Gro. The big drop in the unemployment rate and share of people living in poverty along with a jump in per-capita income landed it at No. 3 on our list.
Population: 22,943
Population growth: 4.1 percent
Per-capita income: $23,253
Per-capita income growth: 12.9 percent
Percentage of families with income of $75,000 or more: 50.9
Change in percentage of families with income of $75,000 or more: 33.9 percent
Percentage of people living below the poverty line: 7.3 percent
Change in percentage of people living below the poverty line: -38.1 percent
Unemployment rate: 3 percent
Change in unemployment rate: -41.2 percent
4. Haines City, FL
At 39 miles southwest of Orlando, Haines City barely qualified for our ranking. One of the biggest drivers of its fourth-place ranking is the big drop in the local unemployment rate. Haines City benefits from its close proximity to Walt Disney World, Legoland Florida and other tourist attractions in central Florida.
Population: 21,135
Population growth: 4.2 percent
Per-capita income: $15,443
Per-capita income growth: 10.4 percent
Percentage of families with income of $75,000 or more: 16.7 percent
Change in percentage of families with income of $75,000 or more: 21 percent
Percentage of people living below the poverty line: 22.5 percent
Change in percentage of people living below the poverty line: -28.3 percent
Unemployment rate: 4.2 percent
Change in unemployment rate: -51.2 percent
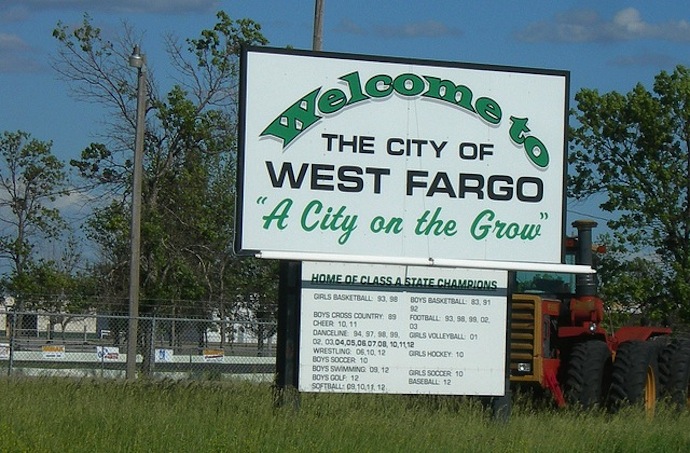
5. West Fargo, ND
 West Fargo is a little more than five miles west of, you guessed it, Fargo. Its ranking is a result of substantial growth in population and per-capita income as well as a sizeable drop in unemployment. West Fargo is the fifth largest city in North Dakota.
Population: 27,999
Population growth: 12.2 percent
Per-capita income: $31,752
Per-capita income growth: 12.6 percent
Percentage of families with income of $75,000 or more: 54.7 percent
Change in percentage of families with income of $75,000 or more: 24 percent
Percentage of people living below the poverty line: 6.7 percent
Change in percentage of people living below the poverty line: -23.9 percent
Unemployment rate: 1.2 percent
Change in unemployment rate: -40 percent
6. Webster Groves, MO
 Almost 12 miles southwest of St. Louis, Webster Groves is home to Webster University. Its population hasn’t grown much recently, but per-capita income has. On top of that, the unemployment rate is down nearly 31 percent.
Population: 23,062
Population growth: 0.4 percent
Per-capita income: $47,367
Per-capita income growth: 20.5 percent
Percentage of families with income of $75,000 or more: 66.6 percent
Change in percentage of families with income of $75,000 or more: 4.7 percent
Percentage of people living below the poverty line: 4.3 percent
Change in percentage of people living below the poverty line: -54.3 percent
Unemployment rate: 2.7 percent
Change in unemployment rate: -30.8 percent
7. Forest Hills, MI
 Just east of Grand Rapids, Forest Hills has high and fast-growing per-capita income and an extraordinarily low poverty rate. The Forest Hills Public School District is ranked among the best school districts in Michigan.
Population: 27,338
Population growth: 5 percent
Per-capita income: $52,084
Per-capita income growth: 17.6 percent
Percentage of families with income of $75,000 or more: 77.5 percent
Change in percentage of families with income of $75,000 or more: 5.2 percent
Percentage of people living below the poverty line: 1 percent
Change in percentage of people living below the poverty line: -79.2 percent
Unemployment rate: 3.7 percent
Change in unemployment rate: 0 percent
8. Chelsea, MA
 Chelsea, a suburb of Boston, is the smallest city in Massachusetts as measured by the amount of land (2.21 square miles). Per-capita income growth here is higher than anywhere else on our list. Chelsea’s unemployment rate has fallen, too, although it remains somewhat high.
Population: 36,905
Population growth: 5.8 percent
Per-capita income: $22,530
Per-capita income growth: 30.6 percent
Percentage of families with income of $75,000 or more: 31.4 percent
Change in percentage of families , with income of $75,000 or more: 57 percent
Percentage of people living below the poverty line: 20.8 percent
Change in percentage of people living below the poverty line: -18.8 percent
Unemployment rate: 7.6 percent
Change in unemployment rate: -7.3 percent
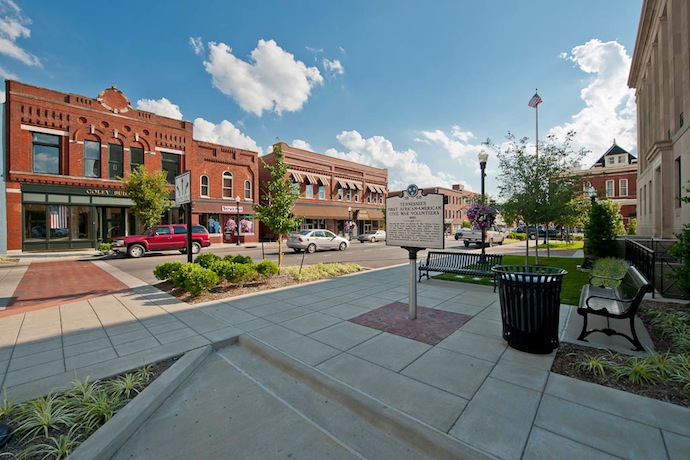
9. Gallatin, TN
 One of the biggest employers in Gallatin, 30 miles northeast of Nashville, is a distribution center for clothing retailer Gap Inc. Gallatin scored well across all categories, but did especially well in per-capita income growth.
Population: 31,640
Population growth: 6.3 percent
Per-capita income: $27,566
Per-capita income growth: 19.9 percent
Percentage of families with income of $75,000 or more: 41 percent
Change in percentage of families with income of $75,000 or more: 49.1 percent
Percentage of people living below the poverty line: 12 percent
Change in percentage of people living below the poverty line: -18.4 percent
Unemployment rate: 4.2 percent
Change in unemployment rate: -22.2 percent
10. Bloomingdale, IL
 Not quite 30 miles west of Chicago, Bloomingdale scored especially well in two categories: the reduction in poverty and unemployment. NOW Foods, a major manufacturer of products for health food stores, is based in Bloomingdale.
Population: 22,269
Population growth: 1.5 percent
Per-capita income: $36,661
Per-capita income growth: 1.4 percent
Percentage of families with income of $75,000 or more: 62.8 percent
Change in percentage of families with income of $75,000 or more: 18.9 percent
Percentage of people living below the poverty line: 4.5 percent
Change in percentage of people living below the poverty line: -34.8 percent
Unemployment rate: 3.3 percent
Change in unemployment rate: -52.2 percent
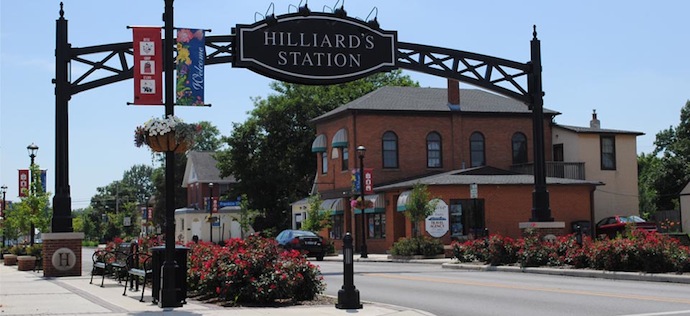
11. Hilliard, OH

Hilliard, the second Columbus suburb to make our list, is home to the Early Television Museum. It had the third-highest reduction in unemployment of all of the suburbs in the top 12.
Population: 29,788
Population growth: 8 percent
Per-capita income: $35,769
Per-capita income growth: 7.5 percent
Percentage of families with income of $75,000 or more: 67.1 percent
Change in percentage of families with income of $75,000 or more: 13.7 percent
Percentage of people living below the poverty line: 3.8 percent
Change in percentage of people living below the poverty line: -25.5 percent
Unemployment rate: 3.1 percent
Change in unemployment rate: -50.8 percent
12. Mint Hill, NC
 A suburb of Charlotte, Mint Hill scored especially well in the reduction of poverty and unemployment. The North Carolina Korean War Veterans Memorial is in Mint Hill.
Population: 23,913
Population growth: 6.2 percent
Per-capita income: $32,652
Per-capita income growth: 6.3 percent
Percentage of families with income of $75,000 or more: 55 percent
Change in percentage of families with income of $75,000 or more: 12.9 percent
Percentage of people living below the poverty line: 6.5 percent
Change in percentage of people living below the poverty line: -39.8 percent
Unemployment rate: 3.2 percent
Change in unemployment rate: -39.6 percent
Methodology
For the changes from 2010 to 2013, we used the percentage-change formula, which shows how much change has occurred compared with the base value. The formula is (new value-original value)/original value, which represents the amount of the change divided by the original amount. So, if the unemployment rate changed from 4 percent to 3 percent, the absolute change would be 1 percentage point, but the percentage change formula would tell us how big that absolute change was compared with the original value of 4 percent. The math: (3-4)/4 = -1/4 = -0.25 = -25 percent.
Data source: U.S. Census Bureau


